marinetics blog
Bioinformatics Solutions in Ecology and Evolution
Related Posts
- 05 May 2017 » Selecting MethylRAD tags with less degenerate adaptor ends
- 11 Apr 2017 » In silico digestion with type IIB restricrion enzymes
- 23 Sep 2015 » R package 'MaxentVariableSelection' released
How much do your paired-end reads overlap? Let’s assume your forward and reverse reads each cover 300 bp (base pairs). Now, do they overlap fully and cover only a range of 300 bp in the genome? Or do they span across 1500 or so bp of your genome with an uncovered gap of 900 bp between the forward and reverse read?
The script Bowtie2FragmentLengths.py will give you the answer. It
informs you about the average base-pair-length from the first mapping
position of your forward read to the last mapping position of your
reverse read.
The script requires that the base pair length between the forward and reverse read was stored in the ninth column of the alignment file (named as the TLEN column in the SAM format specification http://samtools.github.io/hts-specs/SAMv1.pdf). The script was tested on Bowtie2 alignments of paired-end reads but should work on any other SAM file.
Download
You can download the script Bowtie2FragmentLengths.py from
https://gist.github.com/alj1983/901e7cf7b57aae80f103/download
How to use it?
usage: Bowtie2FragmentLengths.py [-h] [-s SAM]

Creates a histogram on fragment lengths covered by paired end reads

arguments:
  -h, --help         optional argument to show this help message and exit
  -s SAM, --sam SAM  sam file name
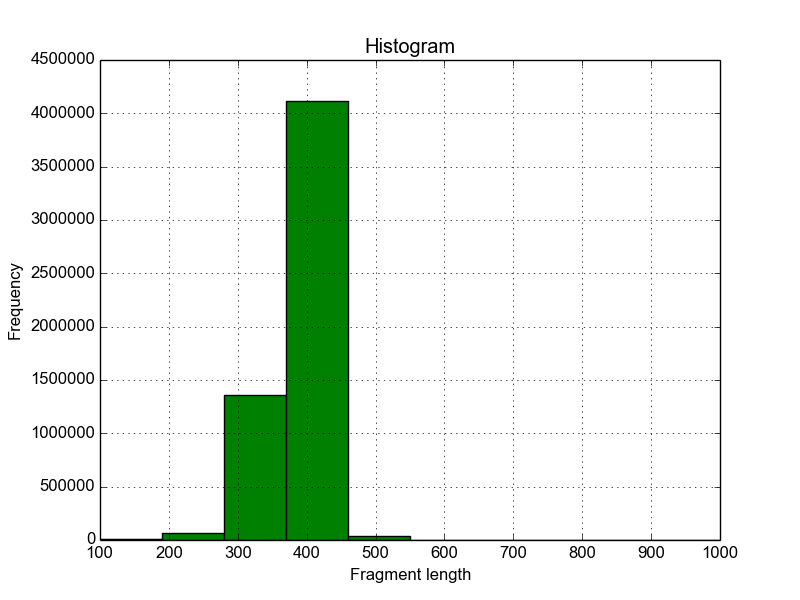
The program print two lines informing you about the mean and standard error of fragment lengths covered by your mapped paired-end reads. For example:
Mappingfile.sam  Fragment length  -  mean:           391.00
Mappingfile.sam  Fragment length  -  standard error:   0.02
In addition, a histogram is plotted that shows the fragment length
distribution of all mapped reads. The historgram is saved in a file
with the suffix FragmentLength_Histogram.png.

Figure 1: Histogram of fragment lengths covered by mapped paired-end reads
Code
#!/usr/bin/python
import re # to use regular expressions
import argparse # To allow users setting flags in order to define what to filter for.
import math # to calculate sqrt
from pylab import figure, title, xlabel, ylabel, hist, axis, grid, savefig # to draw a historgram

parser = argparse.ArgumentParser(description="Creates a histogram on fragment lengths covered by paired end reads")
parser.add_argument("-s","--sam", help="sam file name")
args=parser.parse_args()
# Define the search patterns:

HeaderPattern= re.compile('^@')
SamFileNamePattern = re.compile('(.*)\.sam')


def Fraglength(samfile):
     '''
     Creates a histogram on fragment lengths covered by paired end reads
     '''
     sam=open(samfile)
     OutfilePrefix1 =SamFileNamePattern.match(samfile) # define outfile
     OutfilePrefix=OutfilePrefix1.group(1)
     Lengths=[] #Create an empty list
     for line in sam:
         line=line.strip()
         if not HeaderPattern.search(line): # If this is a header line then skip it
              splitted=line.split('\t') # Split the lines by tab separators
              Lengths.append(abs(int(splitted[8]))) # Pick out the 9th column, which is the inferred fragment length (output by the bowtie2 mapper) and get the absolute integer value from it
     mean=float(sum(Lengths)/len(Lengths))
     total = 0.0
     for value in Lengths:
          total += (value - mean) ** 2
     stddev = math.sqrt(total / len(Lengths))
     stderr = stddev / math.sqrt(len(Lengths))

     print samfile, 'Fragment length -           mean:', '%10.2f' % mean
     print samfile, 'Fragment length - standard error:', '%10.2f' % stderr

     # Drawing the historgram
     n_bins = 10
     figure()
     num, bins, patches = hist(Lengths, n_bins, histtype='bar', facecolor='green')
     title('Histogram')
     xlabel('Fragment length')
     ylabel('Frequency')
     axis()
     grid(True)
     savefig(OutfilePrefix + 'FragmentLength_Histogram.png')


Fraglength(str(args.sam))